Read time: 5 minutes 6 seconds

A product framework I’m becoming obsessed with:
Tools that give you X-ray vision.
As you browse the internet and come across interesting companies / websites, a product like SimilarWeb lets you see their monthly traffic volume, high-performing channels, and top search keywords at a glance.
You send 5-50 emails per day, many of them externally, so a tool like Attio lets you visualise key stats about them (revenue, funding, headcount) and about your interaction with them (connection strength, email frequency, key contacts, trends).
Tools that don’t require you to form new habits or datasets - they just plug into your existing activities and provide new insights that were previously invisible to you.
Today’s breakdown is brought to you in partnership with Mixpanel - a tool that gives you X-ray vision into how users interact with your product or website.
Your users are already hitting your page, clicking elements, signing up, reading content, downloading resources, bouncing, returning, and purchasing.
Wouldn’t it be nice to visualise, analyse, and leverage all of these insights, without a technical skillset?
Wonderful product strategy. Rocketship growth. Powerful value-prop.
We loved writing this one! Let’s get into it.
— Tom


Chess Move
The what: A TLDR explanation of the strategy
“Data culture is decision culture.” (McKinsey, 2018)
Without data, companies are flying blind.
In e-commerce, funnel and marketing data is a necessity.
For digital marketplaces, platform data provides the backdrop for business development.
Across other industries like healthcare and finance, simply getting all the data needed to make a decision in one place is considered a massive win.
In the early 2010s, most analytics products catered exclusively to technical users like data analysts and engineers. This meant setting up tracking, building visualisations, and interpreting data required specialised skills.
These constraints created bottlenecks, with technical teams struggling to keep up with data requests from non-technical stakeholders.
Data accessibility and self-service analytics have greatly improved over the past decade.
Yet, many organisations spend much of their time and resources attempting to validate that:
their data is correct,
it paints a comprehensive picture,
and it flows easily across their tools.
Mixpanel reinvented that process by making it simple for all users (with or without analytics experience) to:
Make better decisions: No more guesswork. Make data-driven product decisions independently.
Move faster: Don’t be blocked by data teams. Empower everyone to access any data, anytime.
Align teams: Stop using different metric definitions. Create a data source of truth across the company.
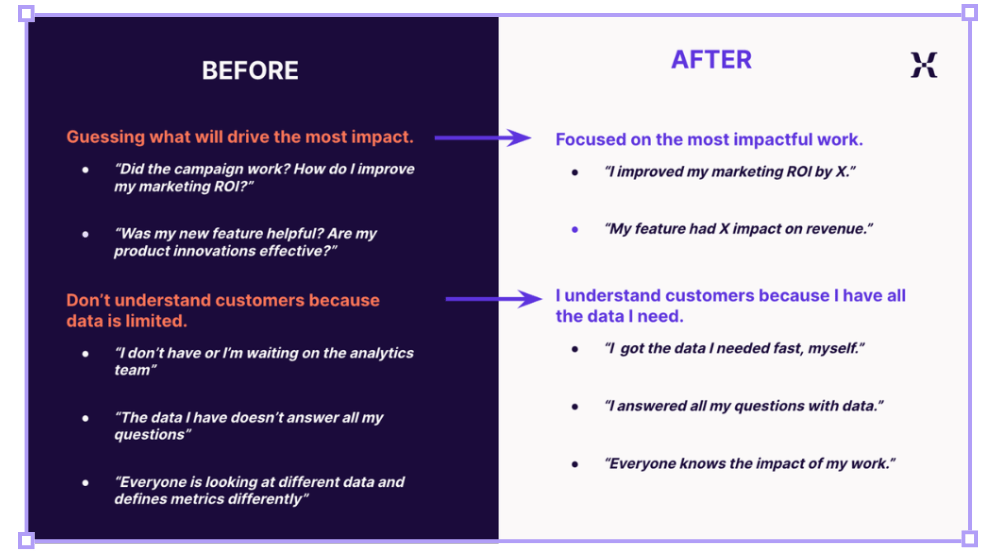
Sneak peak at some behind-the-scenes thinking: How Mixpanel helps organisations transform not just their data infrastructure, but also their understanding of impact
Their goal?
Empowering anyone to be a ‘scientist’ without writing a single line of code, giving teams space to “focus on their most impactful work.”

💡
Strategy Playbook: Deconstruct walled gardens by making your product accessible to everyone


Breakdown
The how: The strategic playbook boiled down to 3x key takeaways
1. Great UI invites new users
Mixpanel's interface abstracts away the complexity of data modelling and transformations.
Event tracking analytics can be complicated. Companies like Google Analytics and Omniture have helped understand the where of web tracking, but there has historically been a gap on the what:
Even with tools specifically designed to track events, the process was complex and time intensive.
It’s not enough for teams to simply track what’s happening inside their products – they must be able to clearly articulate how different changes impact the bottom line.
Mixpanel allows users to track EVERY event – no matter how big or small – to give all teams the data they need to “measure outcome, not output”.

How Mixpanel fits into the modern tech stack - integrating with tools their customers already use
Setting up Mixpanel is a remarkably quick process – admins can install the SDK and immediately start to track their different events. Tracking events and building reports requires no SQL knowledge.
Users can build funnels, A/B tests, attribution, root cause, and cohort analyses through a point-and-click interface with “plain-English” self-service tools. This lowers the barrier to entry for non-technical roles.
Mixpanel then helps teams generate insights much faster, with pre-made:
Visualisations: Structured analyses help to quickly tell stories around the data without spending time on builds.
Filters: Automatically applied to visualisations to focus on individual customer segments.
Breakdowns: Deep-dives to assess if certain cohorts are exhibiting different behaviours to others.
This democratises the power of data and ensures that teams are spending time on understanding and interpreting, instead of building.
Users say that “Mixpanel is damn simple to learn such that you're getting 80% of the value fairly quickly” making the ROI case equally as simple.
2. Put collaboration at the heart of everything
Decisions seldom happen in a silo, so data shouldn’t either.
Yet, many analytics tools make it challenging to share insights broadly across the team.
Mixpanel is disrupting this paradigm, by helping teams ensure data is:
Complete: Quickly connects to your data warehouse to tie revenue to your efforts.
Convenient: Easy to use, intuitive UI, no seat pricing model, beautiful charts.
Consistent: Creates a singular definition of metrics and combines all data into one tool.

Reports can be spun up in minutes, and interpreted by anyone
Mixpanel allows users to create dashboards composed of multiple reports/analyses and share them with specific teammates, or the entire organisation, with just a single link.
This eliminates the need to share static reports.
Makes it easy for anyone to find the data they’re looking for.
And reduces likelihood of data quality issues.
After teams have built their analyses, they can be easily shared across teams and departments through shareable links and integrations with collaboration tools.
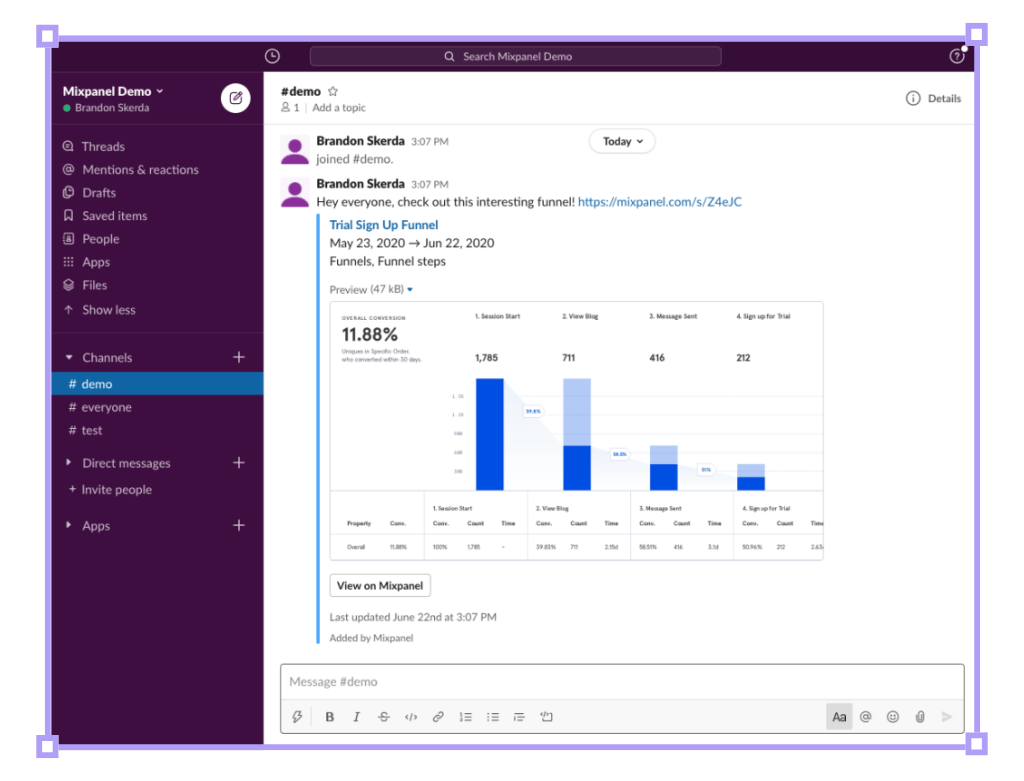
Mixpanel + Slack = Cross-functional visibility
Reports can be easily shared into Slack channels or direct messages, allowing discussions around data to happen in-flow, where teams are already communicating.
Users can add notes and annotations directly onto shared reports to provide context, ask questions, or discuss findings with teammates.
Team members can @mention colleagues on specific annotations or reports to loop them into relevant discussions.
Of course, all data can’t be shared with everyone. Administrators can control who has view/edit access to each report and dataset based on their role, enabling self-service analytics while maintaining data governance policies and privacy on sensitive information.
Collaborative, and secure.
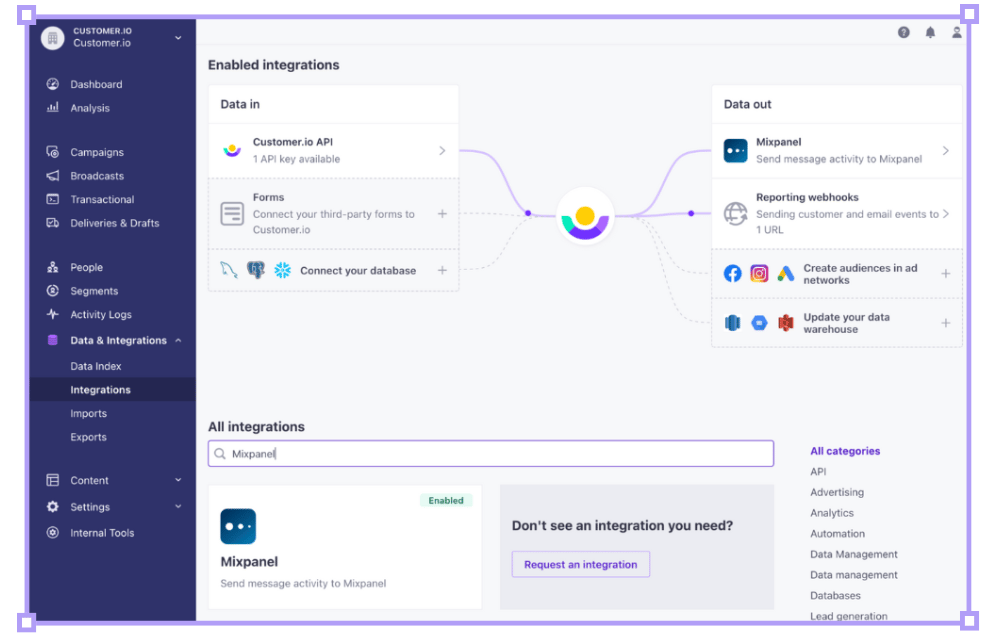
Finally, a visual and intuitive native integration builder
3. Teach your TAM
It’s easy to feel intimidated by analytics. Data leaders are tasked with ensuring data is:
tied directly to revenue data,
accessible to everyone,
and reliable enough to make large-scale decisions.
Historically, nailing these required years of formal training or a technical degree.
Mixpanel bucked this trend by providing an abundance of training resources to help non-technical users drive impact from the data. This was a strategically prudent for two reasons:
It amplifies their impact with existing customers, creating higher ROI.
It helps to grow their Total Addressable Market (‘TAM’)
Mixpanel has developed an “educational ecosystem” to meet customers where they are:
→ Ongoing YouTube webinar series on topics like building data literacy, advanced analysis techniques, integrating data across tools, and product operations.
→ Detailed product proof, showing how customers across industries leverage Mixpanel to enable data-driven decision-making or drive efficiency.
→ Articles from the Mixpanel team that break down new features, analysis methodologies, data visualisation tips and more.
→ Customers can ask questions, share insights, and get implementation support from Mixpanel staff and other users in the online Slack forum.
→ Mixpanel also hosts many in-person events, featuring customer stories, expert speakers, and training workshops.
→ They collaborate with third-party training providers (such as Mammoth Growth and Product School) to create Mixpanel-specific curricula and certification programs.


Shots from the 2022 Mixpanel ProductX Conference and their customer case library.
All of this serves to empower more team members to become power users, and ultimately:


Rabbit Hole
The where: 3x high-signal resources to learn more
[20 minute read]
Mixpanel analysed product data from 7,700 software companies. The results were juicy.
“How do the top 10% percentile B2B SaaS companies outperform the rest at user retention?”
Curious? Check out their Benchmarks Report (it's free)
[59 minute watch]
In 2018, Suhail Doshi, a YC alum, spoke to the YC cohort about iterating relentlessly after launching Mixpanel. Hear his philosophy on:
• Launching MVPs and collecting feedback
• Measuring success and defining great OKRs
• Balancing forces of customer retention vs. NDR
[46 minute listen]
Mixpanel has evolved their product many times over since launch, exploring different business lines and customer segments. Join Head of Product, Vijay Iyengar, for insights around:
Prioritising feature requests based on revenue potential
How Mixpanel collects direct feedback from customers
Mixpanel’s reinvestment strategy for their core product
Your X-ray specs are ready. Ready to try them on?
— Tom Alder and Alex McLelland
P.S. Any questions for the Mixpanel team? We’ll pass them on! Any thoughts on today’s breakdown? Reply directly to this email - we always write back!


Whenever you're ready, there are 3 ways we can help you:
Our flagship course on how to use free internet data to make better strategic decisions. Contains 5 years of strategy expertise, proven methods, and actionable tactics to accelerate your career with modern-day strategy skills.
We have a growing audience of 55,000+ strategists from top companies like Google, Meta, Atlassian, Stripe, and Netflix. Apply to feature your business in front of Strategy Breakdowns readers.
One of the most common questions we get asked is: “What tools do you use to run Strategy Breakdowns?” So, we’ve open-sourced our tech stack to give you an inside-look at exactly what tools we’re using to power each corner of this operation.

